“The Gantt Chart, because of its presentation of facts in their relation to time, is the most notable contribution to the art of management made in this generation.” -Wallace Clark-
Gantt Chart begins with a mechanical engineer called Henry Gantt. He developed and designed the chart around 1910-1915 and it has been first used by the United States during World War 1 for Navy ship building activities.
In 1950’s, it has been mostly used to build the Hoover Dam and highway system in U.S.
Gantt Chart diagram was such a powerful analysis tool for project managers that it was used virtually unchanged for nearly 100 years, until Microsoft Office Project first added ‘connectors’ to these bars in the early 1990’s to show more precise dependencies between tasks.
Gantt Chart Rises
Gantt Chart is widely used because of its simplicity and easy to track progress, manage tasks, and schedule resources. Simple but powerful, how can we not use this tool?
Not only in the past, but until now it is used in various industries like construction, engineering, software development and marketing. When you search Gantt Chart in Google, many sites will be given for you to choose which one to use. As you can see, they are still very oftenly used today because they are so efficient to manage.
Gantt Chart is used only for managers who are professionally trained because it was hard to understand. However, after the development of Gantt Chart, it became easier to use like Mind Map and Kanban Board.
When i first learn about Agile method, i found pretty interesting because of the relation with Gantt Chart. Agile Project definitely needs a Project Manager(Owner) and he/she needs to manage the team with efficient ways. Gantt Chart helps provide to track the status of projects, so that teams can mange, view, communicate, and quickly interact project plans.
The success of the project comes from how to approach to deliver a project throughout its life cycle. There is no straight answer for using Gantt Chart in Agile project, but using Gantt Chart will show you the progress of sprints and determine which tasks to continue going on and which to remove from project.
Map yourself, plan yourself, organize yourself and work with the team in efficient ways. Many collaboration tools are waiting for you.
Sometimes, even if we achieved our goal, if the degree of achievement does not reach that of the competitors, there will be a possibility to be behind in the market competition.
Among business activities, there are operational projects that must be carried out daily for existing business, and there are projects that must be started and completed during a specific period. Due to the temporary nature of the project, there are problems such as difficulty in estimating the processing time and cost for newly promoted projects.
Clovine makes teammates happy. Not only teammates, but also new people.
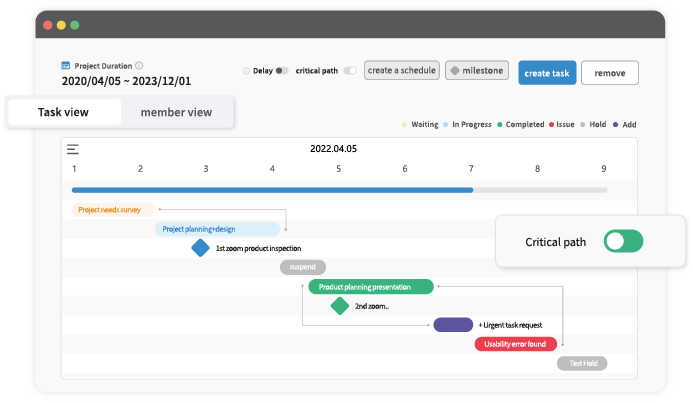
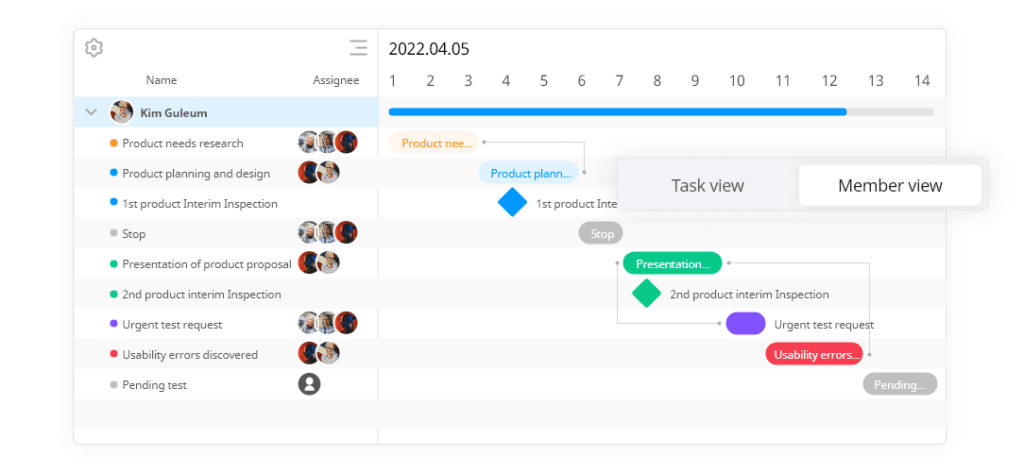
Clovine‘s Gantt Chart offers easy and quick analysis tools. Delays in tasks can be predicted just by activating the critical pass button and risks following such can be prevented. If project schedules are simply listed up, the extent of delays in schedules and workflow might be missed in some cases. Here, the Clovine enables you to check words from various perspectives while managing with ease.
Make your projects full of happiness with Clovine.